Abstract
 This article presents a description of some of the activities carried out within the Training School on Ground Penetrating Radar (GPR) for road-pavement assessment and detection of buried utilities, organized by the COST Action TU1208 and held in London, UK, on October 12-14, 2015.
More precisely, this document deals with the second practical lesson on the use of GPR equipment provided by UTSI Electronics and devoted to the detection of buried utilities in an outdoor environment. The processing and interpretation of the collected GPR data through the commercial software ReflexW is presented, as well.
Elaborated by
Michał Dąbrowski (1), Margarita Chizh (2), Marco Salucci (3)
(1) Faculty of Earth Sciences,
Nicolaus Copernicus University,
Lwowska 1, 87-100 Toruń, Poland
mh.dabrowski@gmail.com
(2) Remote Sensing Laboratory,
Bauman Moscow State Technical University,
2-nd Baumanskaya str., 5, Moscow, 105005, Russia
mchizh@rslab.ru
(3) ELEDIA Offshore Lab @ Paris
Laboratoire des Signaux et Systèmes (L2S, UMR CNRS 8506)
3 rue Joliot Curie, 91192, Gif-sur-Yvette, France
marco.salucci@unitn.it
I. INTRODUCTION
Ground Penetrating Radar (GPR) is nowadays recognized as one of the most powerful, versatile and robust instruments for performing large-scale subsurface investigations [1]-[4]. Its main applications are the localization of buried pipes and services, as well as the detection of man-made or natural changes in the undersoil stratigraphy and the investigation of archaeological sites. It works by generating an electromagnetic (e.m.) signal that is transmitted towards the soil by single or multiple transmitting antennas. Each discontinuity in the dielectric characteristics below the surface produces a reflection of the incident e.m. waves, and part of this scattered energy reaches the receiving antenna(s). Then, the collected radargram gives the user the possibility to detect the presence of buried obstacles in a completely non-invasive manner.
In order to promote throughout Europe the effective use of this safe and non-destructive inspection method, COST Action TU1208 focuses on the exchange of scientific-technical knowledge and experience of GPR techniques in Civil Engineering. Within the recent activities carried out during the life-time of the Action, a Training School on GPR for road-pavement assessment and detection of buried utilities was organized in London, UK, on October 12-14, 2015.
Besides some theoretical lessons on the basic principles of GPR and its use in civil engineering applications, two practical lessons were devoted to familiarize the trainees with off-the-shelf GPR equipment. More precisely, on the second day of the Training School a practical training was held at the University of West London and guided by Dr. Erica Carrick Utsi and Dr. Vincent Utsi with the help of GPR equipment provided by Utsi Electronics Ltd. The training considered locating subsurface utilities and detecting voids with GPR, as well as the processing and interpretation of the collected GPR data.
The work is organized as follows. The Sect. II describes the outdoor site considered for the practical training, while Sect. III deals with the acquisition of GPR data by different crews. Finally, Sect. IV presents some of the most relevant outcomes from the processing of the experimental data through the commercial software REFLEWX and some conclusions are eventually drawn in Sec. V.
II. PREPARING THE SURVEY
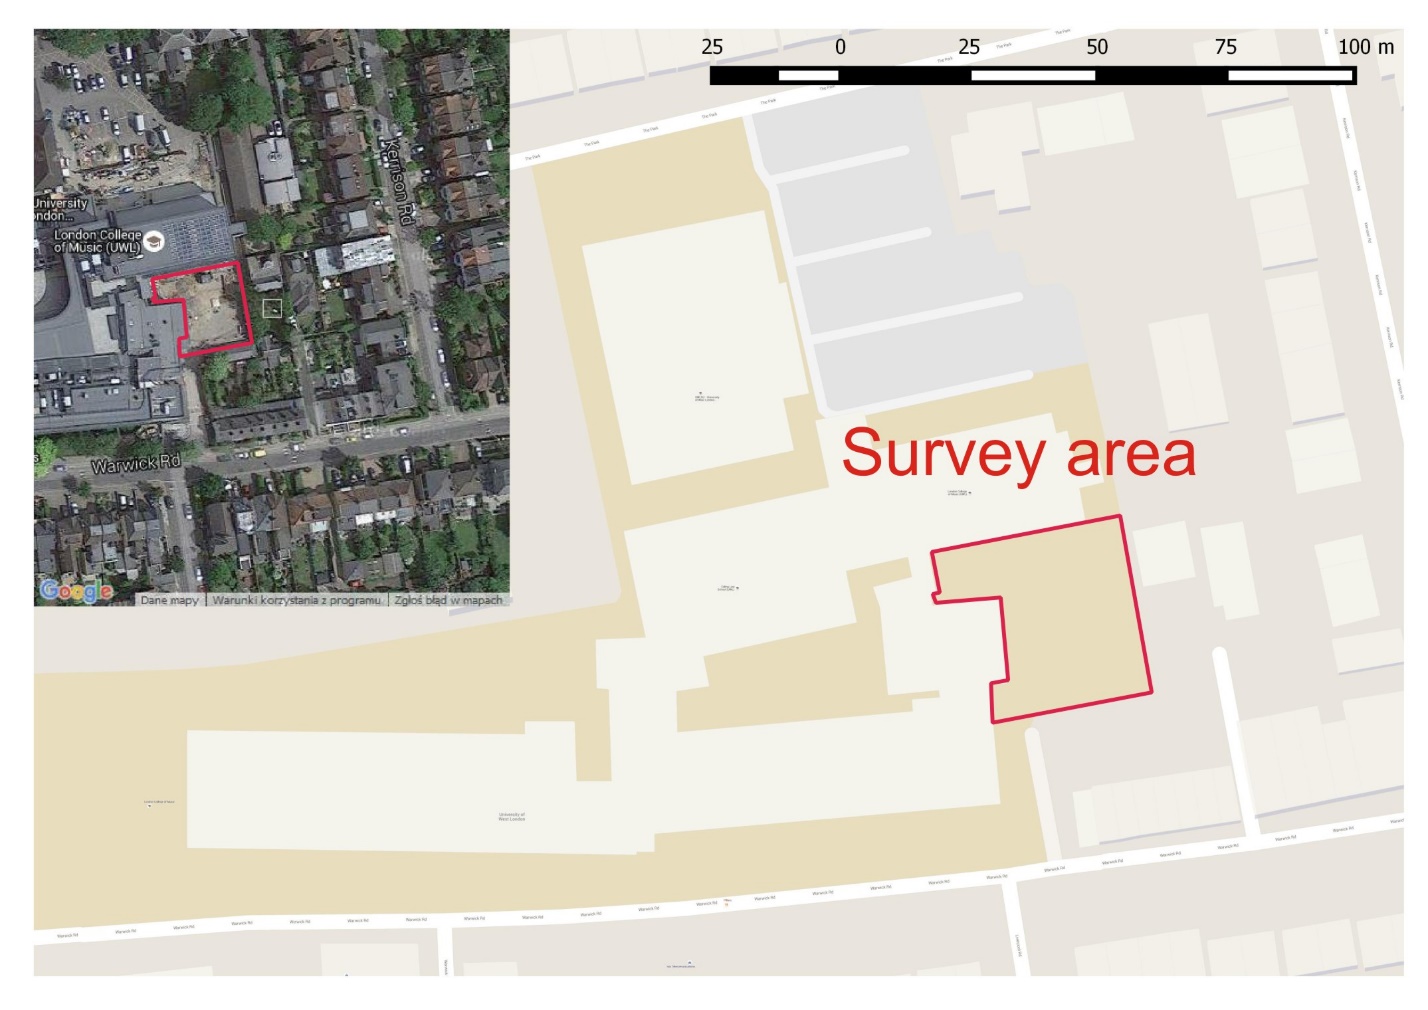
The survey area was located on the grounds of the University of West London, the general map of the area is shown in Fig. 1.
Dr. Erica Carrick Utsi and Dr. Vincent Utsi gave instructions to the trainees on how to carry out the survey (see Fig. 2). The methods of orienting in the field, such as using GPS and establishing a grid, were discussed. Restrictions on the grids size were mentioned since the grid spacing must meet the Nyquist spatial sampling criterion. More precisely, the radar data has to be acquired at equally spaced points and the spacing has to be less or equal to the half of the minimum wavelength of the radar signal
 (1)
(1)
To formulate this criterion in terms of the central frequency we need to consider that for most GPR antenna systems, the bandwidth to center frequency ratio is about one. This means is that the pulse radiated contains energy from 0.5 times the center frequency to 1.5 times the center frequency. As a result, the maximum frequency is around 1.5 times the nominal center frequency of the applied antenna [2]. Thus, the Nyquist spatial sampling criterion is
 (2)
(2)
where is the velocity of the electromagnetic wave in the medium, is the central frequency of the antenna.

Trainees were divided into three crews, about seven people each. The crews chose areas for their surveys and one of the three available radars provided by the Utsi team. The plan of the whole survey area is shown in Fig. 3.

Acquisitions from the first crew were performed by using a GPR from the Groundvue series produced by Utsi Electronics Ltd simultaneously operating at three different frequencies (i.e., 250 MHz, 400 MHz and 1 GHz - Fig. 4).
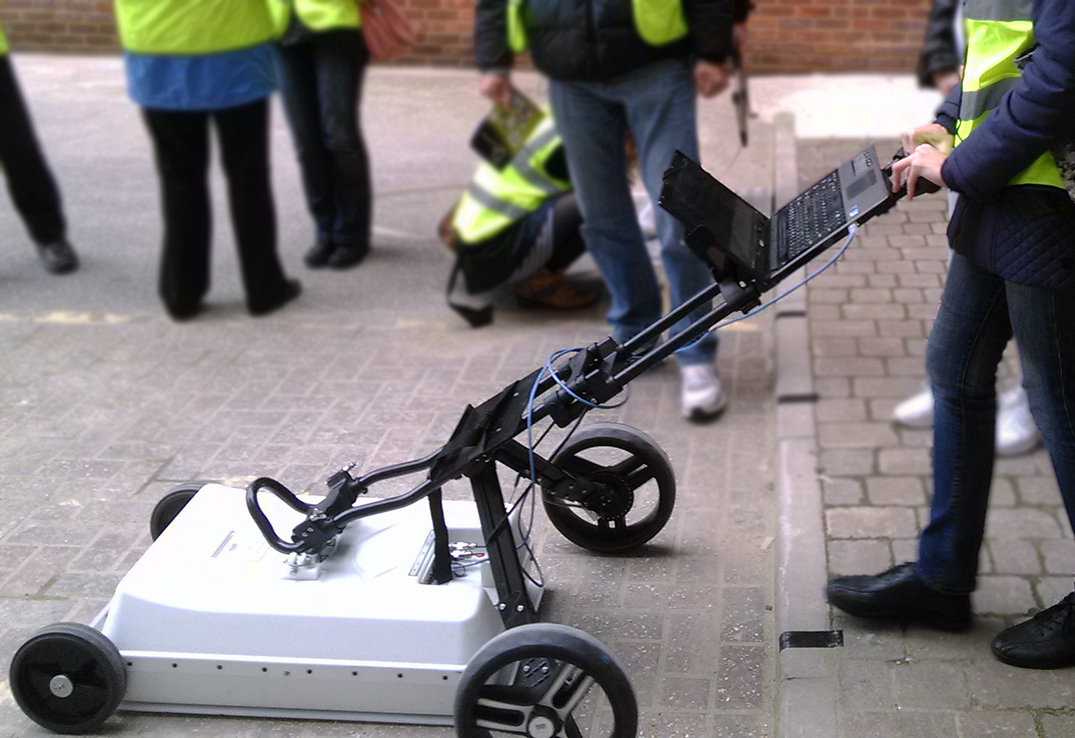
The second crew used a GPR from the same Groundvue series with a single working frequency of 400 MHz. The appearance of the radar is shown in Fig. 5.

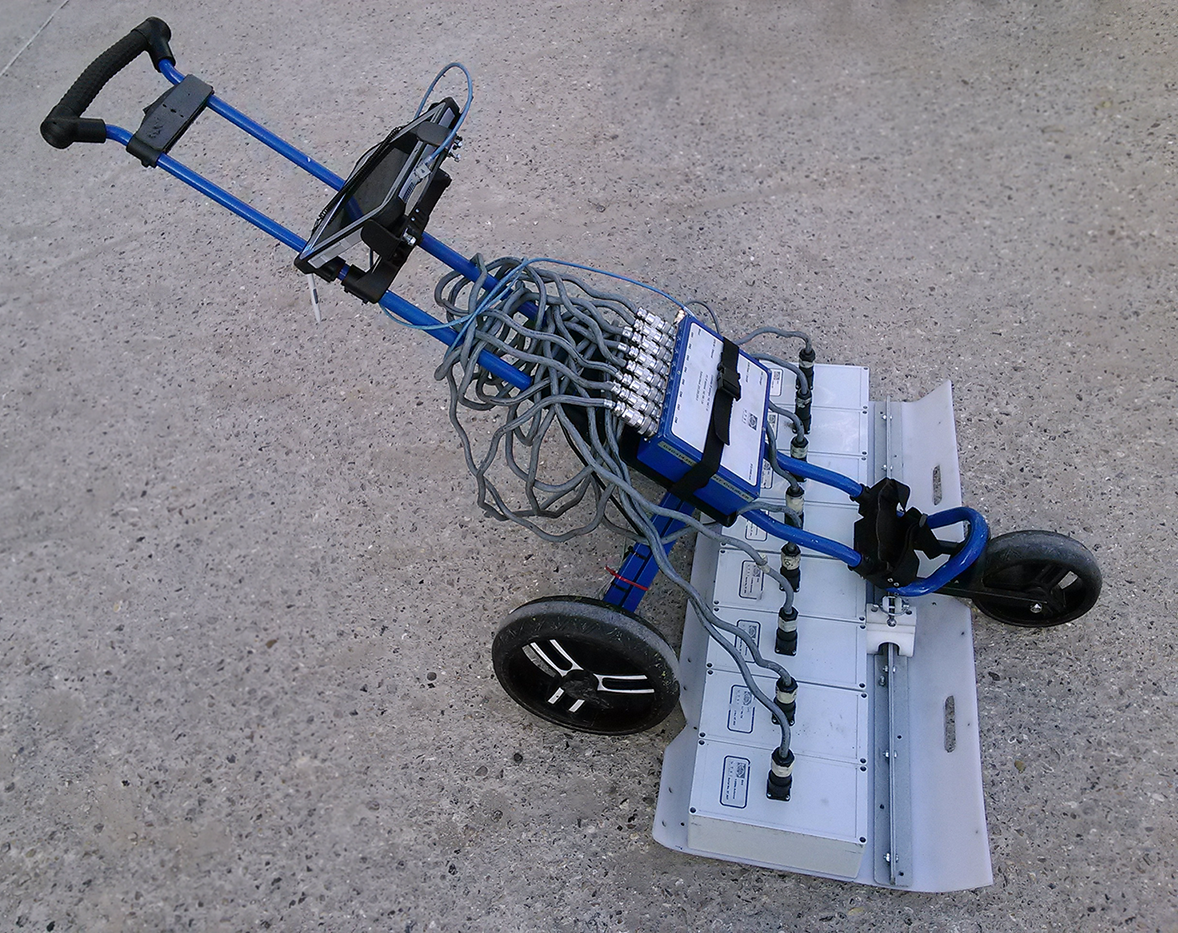
Finally, the third crew performed its acquisitions with a Groundvue multi-channel GPR produced by Utsi Electronics Ltd equipped with 8 channels and operating at 6GHz, 4GHz, 1.5GHz, 1GHz, 400MHz and 250MHz (Fig. 6).
For completeness, the characteristics of the three radars are given in Table 1 in terms of achievable depth range and resolution under different operating frequencies [http://www.utsielectronics.co.uk/].
Table I - Characteristics of the applied GPR
Depth Range
| 6 GHz | up to 0.5 m | in dry conditions |
| 4 GHz | up to 0.5 m | in dry conditions |
| 1.5 GHz | up to 2 m | in dry conditions |
| 1 GHz | up to 2 m | in dry conditions |
| 400 MHz | up to 5 m | in dry conditions |
| 400 MHz | up to 3 m | in wet conditions |
| 250 MHz | up to 10 m | in dry conditions |
| 250 MHz | up to 5 m | in wet conditions |
Resolution
| 6 GHz | 5 mm |
| 4 GHz | 10 mm |
| 1.5 GHz | 15 mm |
| 1 GHz | 20 mm |
| 400 MHz | 40 mm |
| 250 MHz | 80 mm |
III. GPR DATA ACQUISITION
Each crew defined the survey lines within the chosen survey areas considering the Nyquist sampling criterion (Eq. 2). Each crew tried to establish the survey lines perpendicular to the suggested trend of the features under investigation in order to reduce the number of the lines. Tape markers were placed on the ground to indicate the beginning and ending of each line. In the following, we focus our attention on the area investigated by the first crew, to which the authors of this report belonged. The considered GPR profiles configuration by the first crew are shown in Fig. 7.

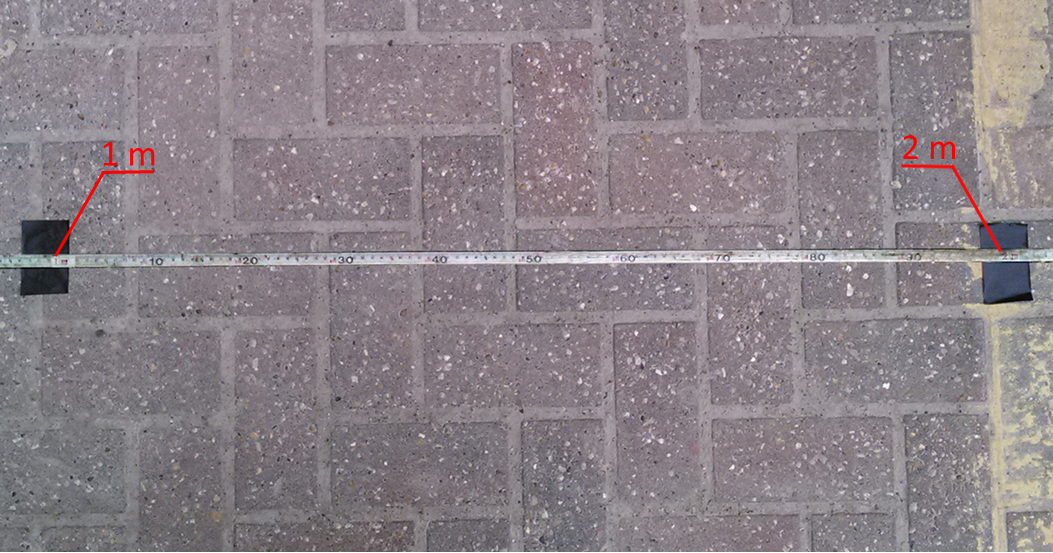
The survey area had size of 4x10 m, and a spacing of 1 m between traces was considered (Fig. 8), leading to a total of 5 longitudinal scans and 11 cross-sections (Fig. 7). The acquired data files were named according to the scan number and the scanning direction (West-East, East-West, North-South, South-North). The North direction was chosen arbitrary to match with the nearest University building.
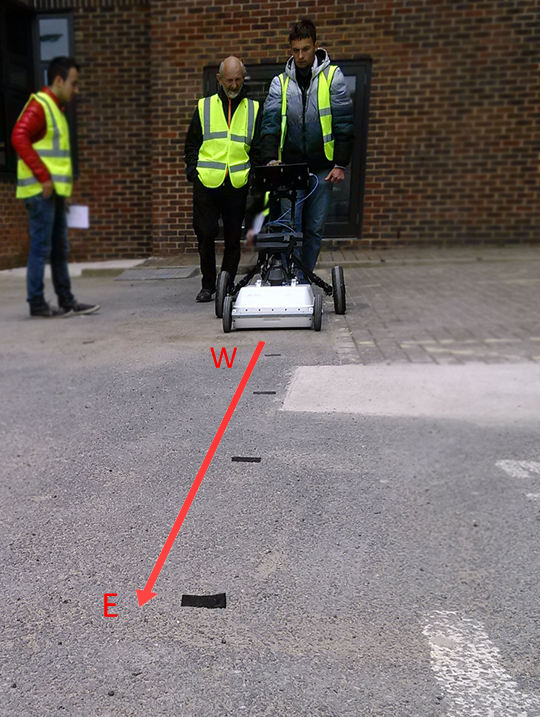
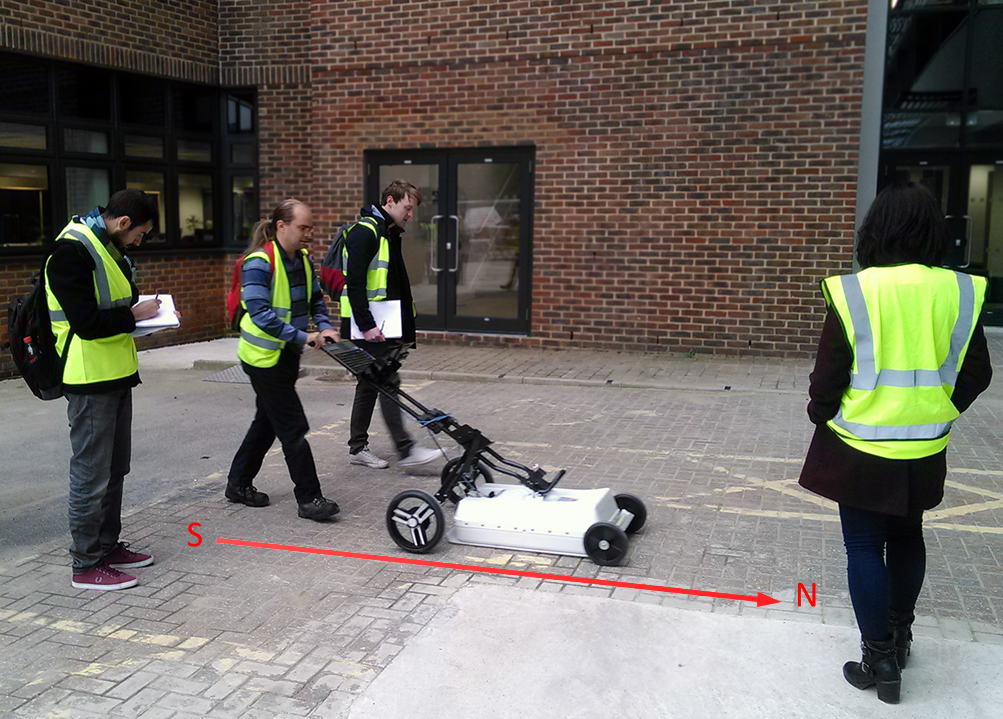
The process of scanning along a longitudinal survey line directed from West to East is shown in Fig. 9, transverse scanning directed from South to North is shown in Fig. 10.
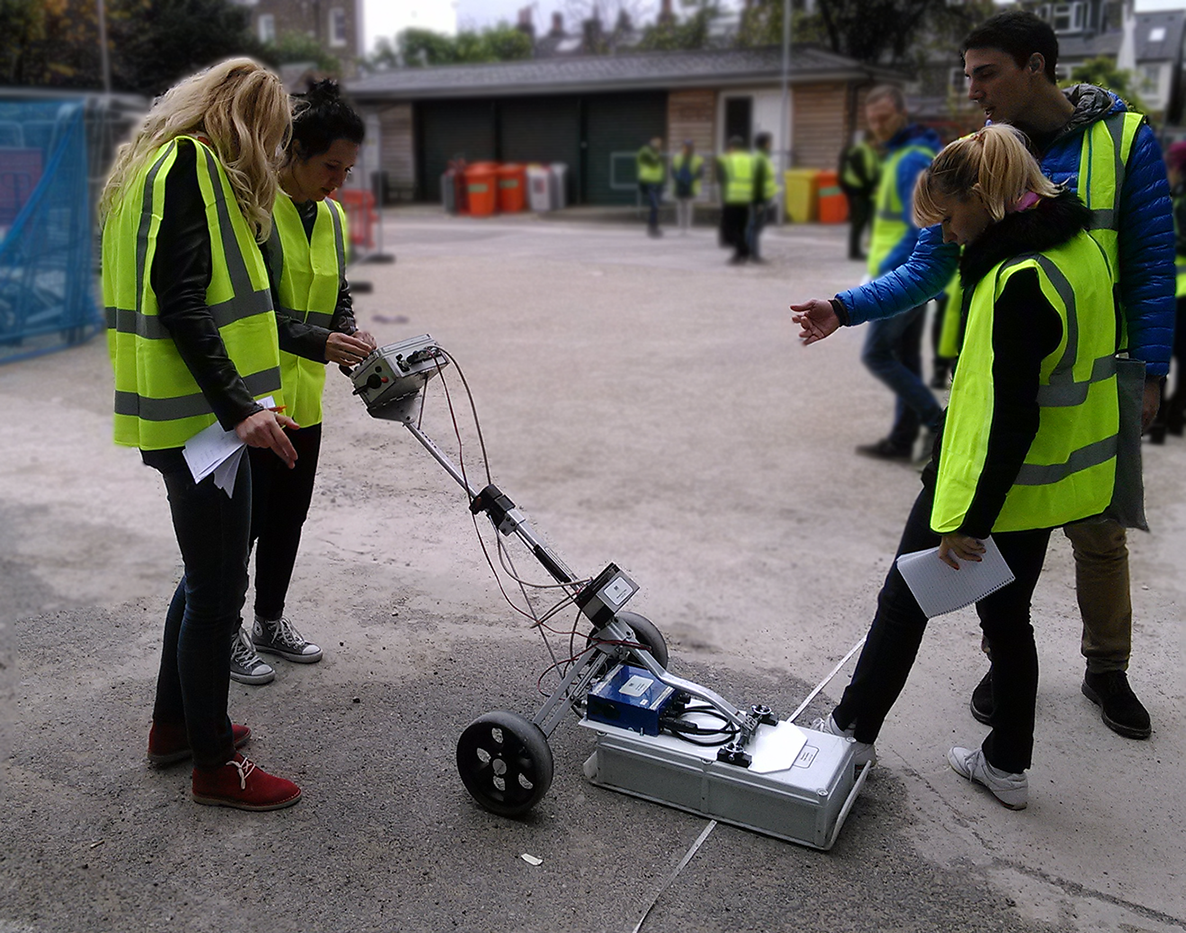
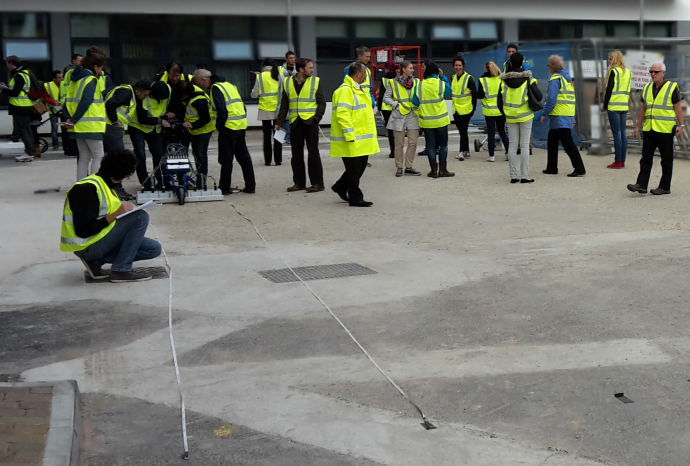
Figs. 11 and Fig. 12 show the acquisition procedure by the other two crews (Crew 2 – Fig. 11 and Crew 3 – Fig. 12).
IV. DATA PROCESSING AND INTERPRETATION
The collected GPR acquisitions were stored into USB sticks or data modules according to the equipment for the successive processing stage.

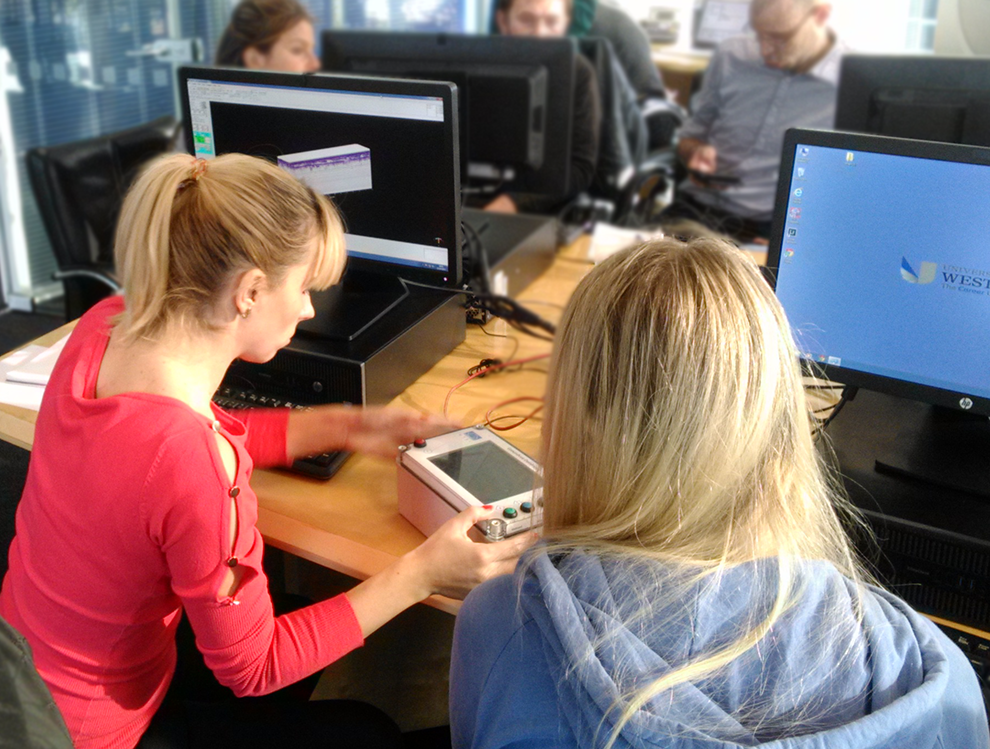
Acquired data was imported inside the commercial software REFLEXW by considering an UTSI input file format and a 32 bit floating point output format. As a preliminary processing, the first temporal part of the collected traces was removed by accurately determining the zero time in the “WiggleWindow” View. Then, a 2D filtering was applied to the collected B-scans in order to remove the background contribution, and a linear gain function was applied in order to enhance the signal amplitude corresponding to the deepest part of the underground region.

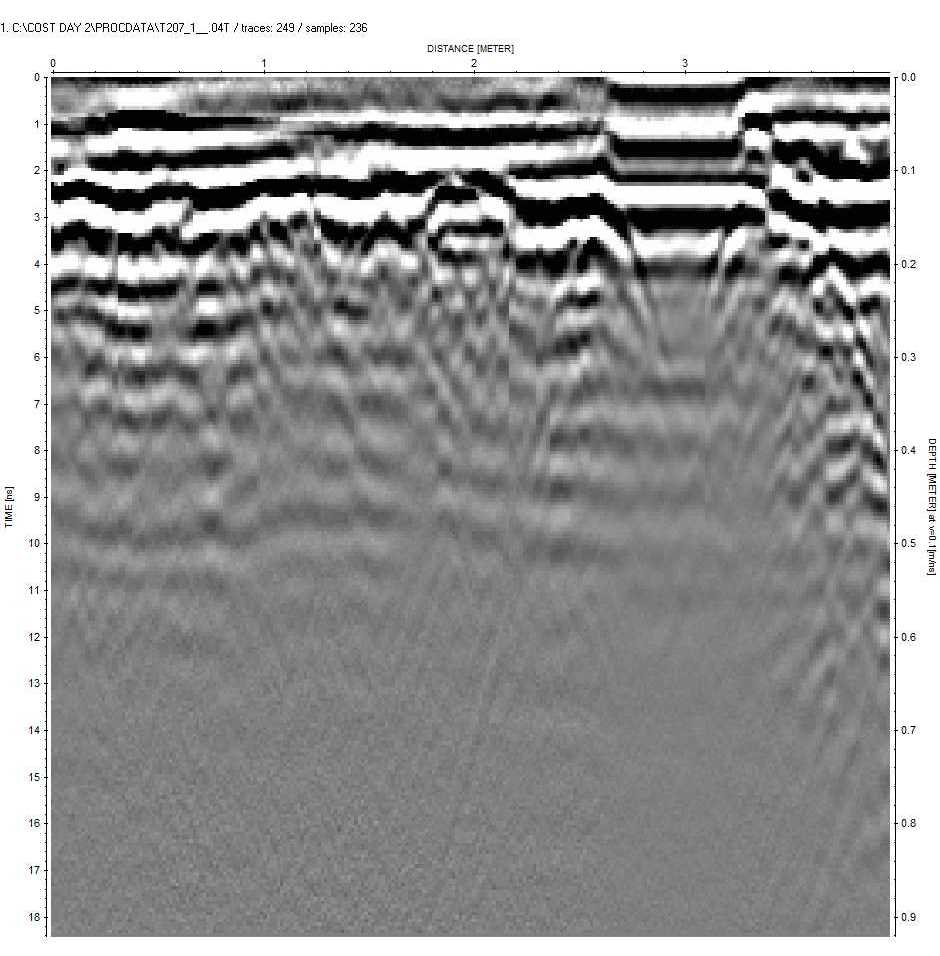
As a representative result of the processing stage, Fig. 17 shows a B-Scan collected along a longitudinal scan by Crew 1 by exploiting a 1GHz antenna. Even if, unfortunately, no underground utilities were detected within the investigated area by Crew 1, the presence of an alteration of the stratigraphy can be easily observed in the reported B-Scan (red dashed circle – Fig. 17). Of course, only hypothesis about the nature of the anomaly can be done without directly accessing it in an invasive manner; however, the overall signal alteration seems to be caused by the presence of an old trench used to bury a pipe, even if this latter cannot be distinguished by analyzing the post-processed radargram.
As a final step of the processing phase, a C-Scan was produced by suitably merging several B-Scans collected along the longitudinal direction. The result of such a processing is shown in Fig. 18 and gives a three-dimensional overview of the entire region investigated by Crew 1.
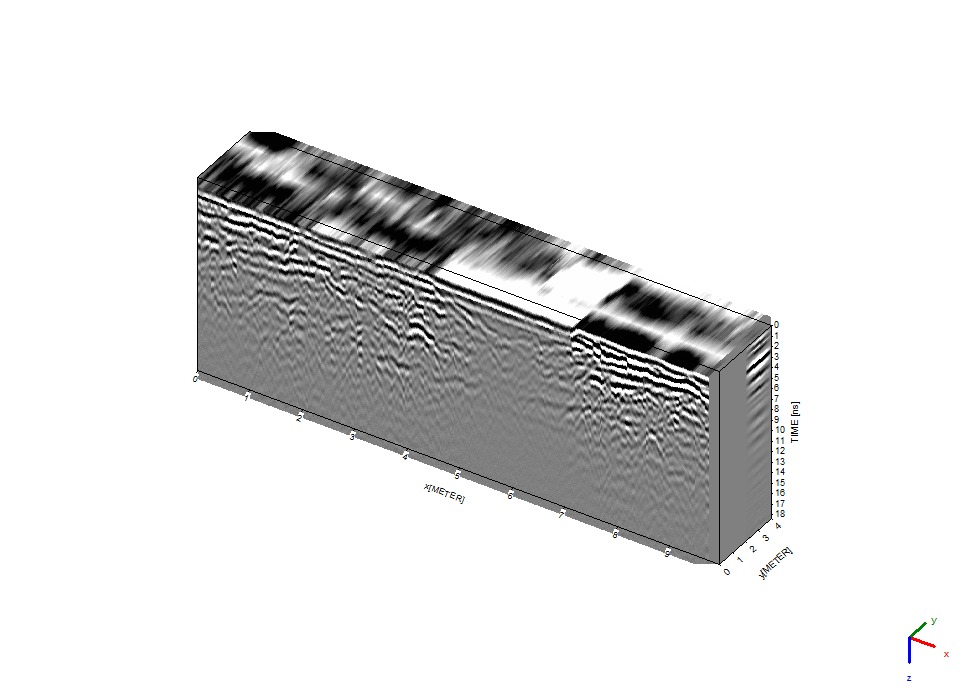
By looking at the C-Scan in Fig. 18, the superficial portion characterized by a higher amplitude of the measured signal (red dashed circle) corresponds to an area occupied by concrete.
V. CONCLUSION
Ground Penetrating Radar method is one of the most powerful electromagnetic tools for imaging subsurface area. Depending on what we expect to image, we have to carefully choose antenna frequency which is directly connected to the depth of survey and resolution. Design of a survey should be done after field recognition of the survey area. The distance between profiles should be properly matched to avoid spatial aliasing. Profiles and data acquisition must be precisely positioned to local geodetic reference system.
However, even though the GPR is an excellent em. wave method, in some cases it is useless due to high conductivity of shallow subsurface layers, wet or strong saline ground, where wave is strongly attenuated. It is important to remember that GPR method has restrictions and in some cases we cannot apply it.
Survey is the first step of GPR imaging. The next most important thing is processing and interpretation of the data. Processing uses advanced algorithms to filter coherent and non-coherent noise, signal gain, spherical divergence compensation, frequency filtration, FK analyses and many others. Final step is migration, which is the most advanced computational method to move reflection to proper position on the radar sections. Of course, these are some examples of processing procedures; in the ReflexW processing software we can find hundreds of procedures which satisfy the most demanding users.
Interpretation mostly covers recognition and description of what we actually imaged. We can present data in a flexible way in B-scan and 3D distribution, generate cross sections of whatever we want, timeslices and many other spatial plots.
GPR method is an interdisciplinary method used for the engineering purposes. Electromagnetic survey allows to image concrete structure, cracks and rebars in the civil engineering, such as roads pavement, tunnels, undergrounds, bridges, airports, railways, as well as to image underground infrastructure and buried objects on the construction site. This method is commonly used in environmental engineering, geology, archaeology, forensic investigation, mineral exploration and others, where the need to use nondestructive method arises. GPR is a fast and efficient method which can be used instead of, e.g. expensive and destructive drilling methods. This method is constantly under dynamic development, as it can be seen by the increasing number of manufactures producing GPR equipment and the numbers of scientists involved in researches. Year by year, we can see the rapid growth of market and many new commercial purposes.
VI. REFERENCES
[1] A. Benedetto and L. Pajewski, Eds., “Civil Engineering Applications of Ground Penetrating Radar,” Springer Transactions in Civil and Environmental Engineering, 2015.
[2] Harry M. Jol, Ground Penetrating Radar Theory and Applications, Elsevier, 2008, 508 p.
[3] R. Persico, Introduction to Ground Penetrating Radar: Inverse Scattering and Data Processing, London, UK: Wiley-IEEE Press, 2014.
[4] L. Peters, J. J. Daniels, and J. D. Young, “Ground penetrating radar as a subsurface environmental sensing tool,” IEEE Proc., vol. 82, no. 12, pp. 1802-1822, Dec. 1994.