Abstract
 This article presents a description of training carried out within the Training School on Numerical modelling of Ground Penetrating Radar using gprMax, organized by the COST Action TU1208 and held in Thessaloniki, Greece, on November 9-11, 2015. Elaboration deals with the example of use gprMax, cylinders buried in the half space. The processing of the modelled GPR data done through the commercial software GPRSoft PRO (Geoscanners AB) to show sample of processing procedures applied to detection of buried objects.
Elaborated by
Michał Dąbrowski
PhD student , Nicolaus Copernicus University in Torun, Faculty of Earth Science, Department of Geology and Hydrogeology, e-mail: mh.dabrowski@gmail.com
Introduction
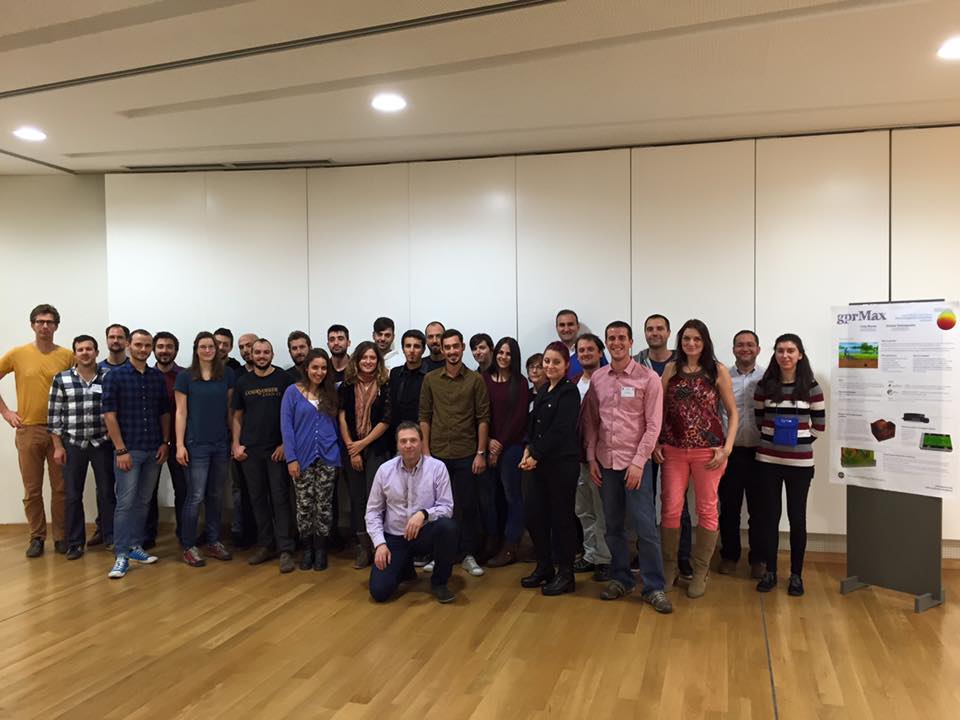
A training, organized by the European Cooperation of Science and Technology, was held between 9-11 November 2015 at the Aristotle University of Thessaloniki. The subject of the training was numerical modelling of GPR using gprMax, a software that simulates electromagnetic wave propagation in 2D or 3D space.
The training was lead by the author - Dr Antonis Giannopoulos - graduate of the Aristotle University of Thessaloniki, currently an employee at the University of Edinburgh, and his colleague Dr Craig Warren, who discussed non-metallic landmines detection and numerical modelling of high-frequency GPR antennas in his doctor’s thesis. gprMax is a free software which has been in constant development since the 1990s. In its latest version, the entire source code has been rewritten in a new programming language with Python used as the main language for the environment.
The two-part training was held over 3 days. The first theoretical part included GPR basics, numerical methods and Maxwell theory basics. The second practical part was where our experience with the software has actually started.
gprMax description
gprMax does not feature a graphical user interface (GUI). All operations are executed in the MS Windows or Linux command prompt window. The system requires the latest Python 3.5 version (recommended) and libraries listed by the author at www.gprmax.com. The models are designed as text, i.e. each element is defined by numerical parameters. All operations, including modelling, geometry view, result plot etc. are called from the command prompt. It is a relatively arduous task, however it is easy to get used to it and memorize all the commands.
The software allows modelling in 1D, 2D and 3D. The nomenclature in English includes the following terms: A scan - i.e. 1D, a single electromagnetic pulse in a single position with medium response recording. B scan - 2D, a collection of multiple A scans e.g. along a specific profile at an equal distance interval between 1D scans. C scan - a collection of multiple B scans, 2D profiles including orthogonal profiles, in Polish nomenclature referred to as a pseudo-3D or 2.5 D, since it is not a strict 3D, as used in the 3D seismic survey.
Cylinder buried in the half-space
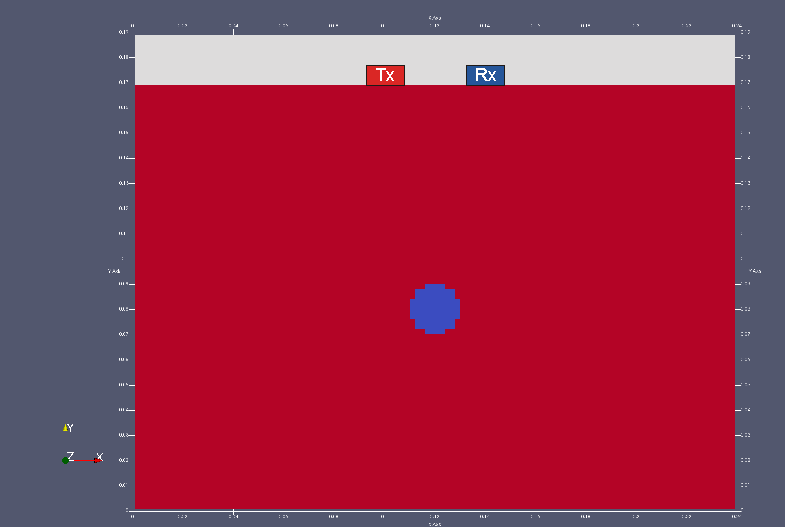
A batch file for 1D modelling is shown below. Generally, it is a ground medium delimited by soil and air at the top with a cylindrical object in the middle (e.g. a pipe).
1 2 3 4 5 6 7 8 9 10 11 12 13 14 15 16 17 |
#title: A-scan metalowego cylindra położony w dielektrycznej półprzestrzeni
#domain: 0.240 0.190 0.002
#dx_dy_dz: 0.002 0.002 0.002
#time_window: 3e-9
#time_step_limit_type: 2D
#pml_cells: 10 10 0 10 10 0
#material: 6 0 1 0 half_space
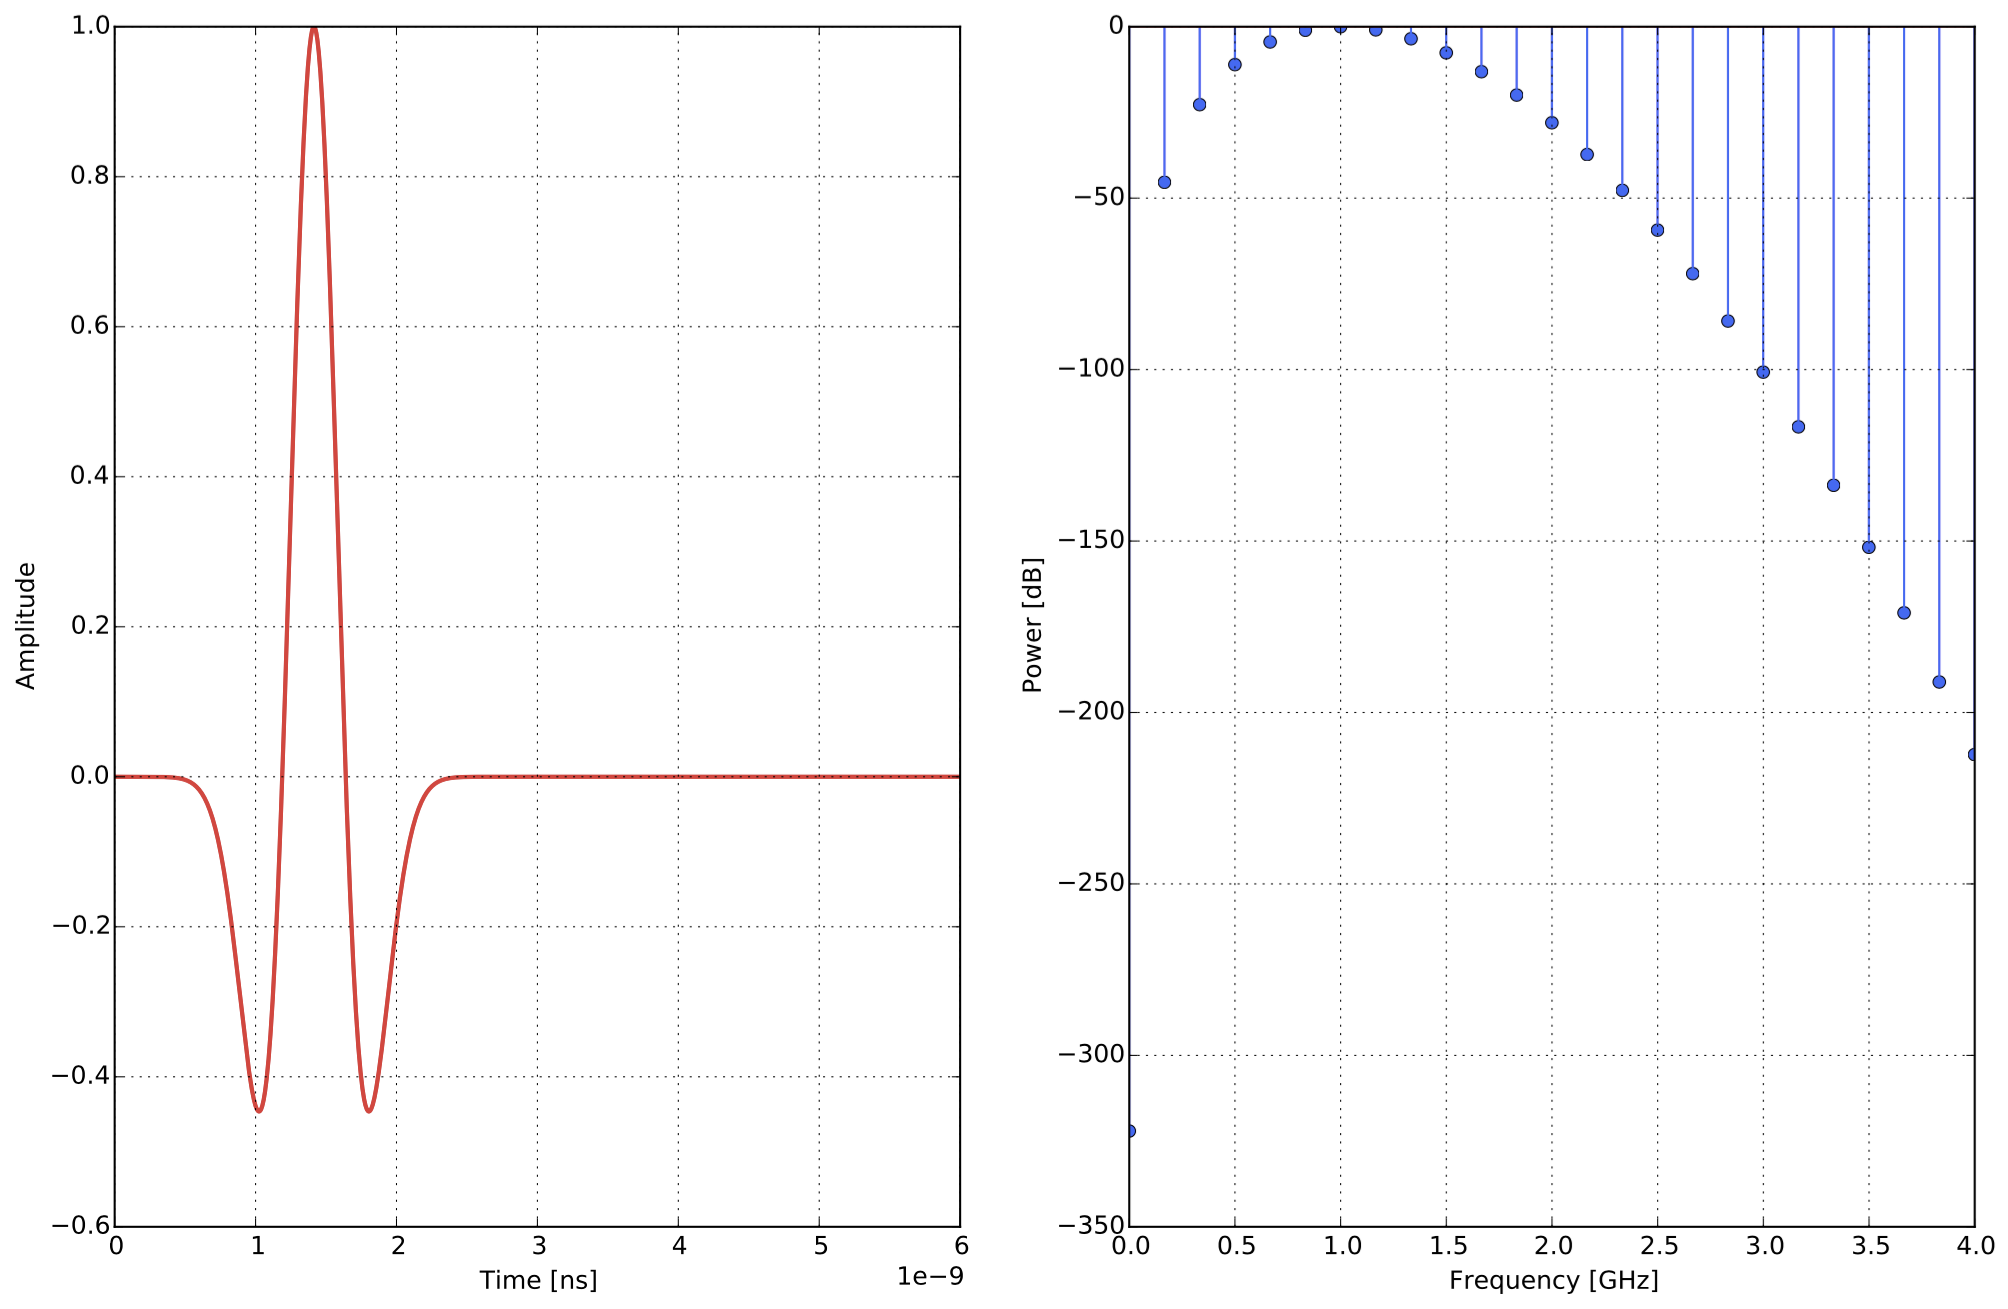
#waveform: ricker 1 1.5e9 my_ricker
#hertzian_dipole: z 0.100 0.170 0 my_ricker
#rx: 0.140 0.170 0
#box: 0 0 0 0.240 0.170 0.002 half_space
#cylinder: 0.120 0.080 0 0.120 0.080 0.002 0.010 pec
#geometry_view: 0 0 0 0.240 0.190 0.002 0.002 0.002 0.002 cylinder_half_space n
|
Figure 2. A-scan parameters (www.gprmax.com)
The file includes a description of the calculated model.
#title: Project name
#domain: Modelling space x,y,z
#dx_dy_dz: The smallest numerical cell in x,y,z
#time _window: Modelling time
#pml_cells: Amount of attenuated cells on the border
#material: Material parameters, RDP, resistivity
#waveform: Wavelet type and center frequency, in that case Ricekr’s 1.5 GHz
#hertzian_dipole: Source position x,y,z and defined wavelet
#rx: Receiver position
#box: Rectangle box position, dimension and parameters, must contain in defined space: #domain
#cylinder: Cylinder position, dimension and parameters
#geometry_view: Generate geometry view
Output files
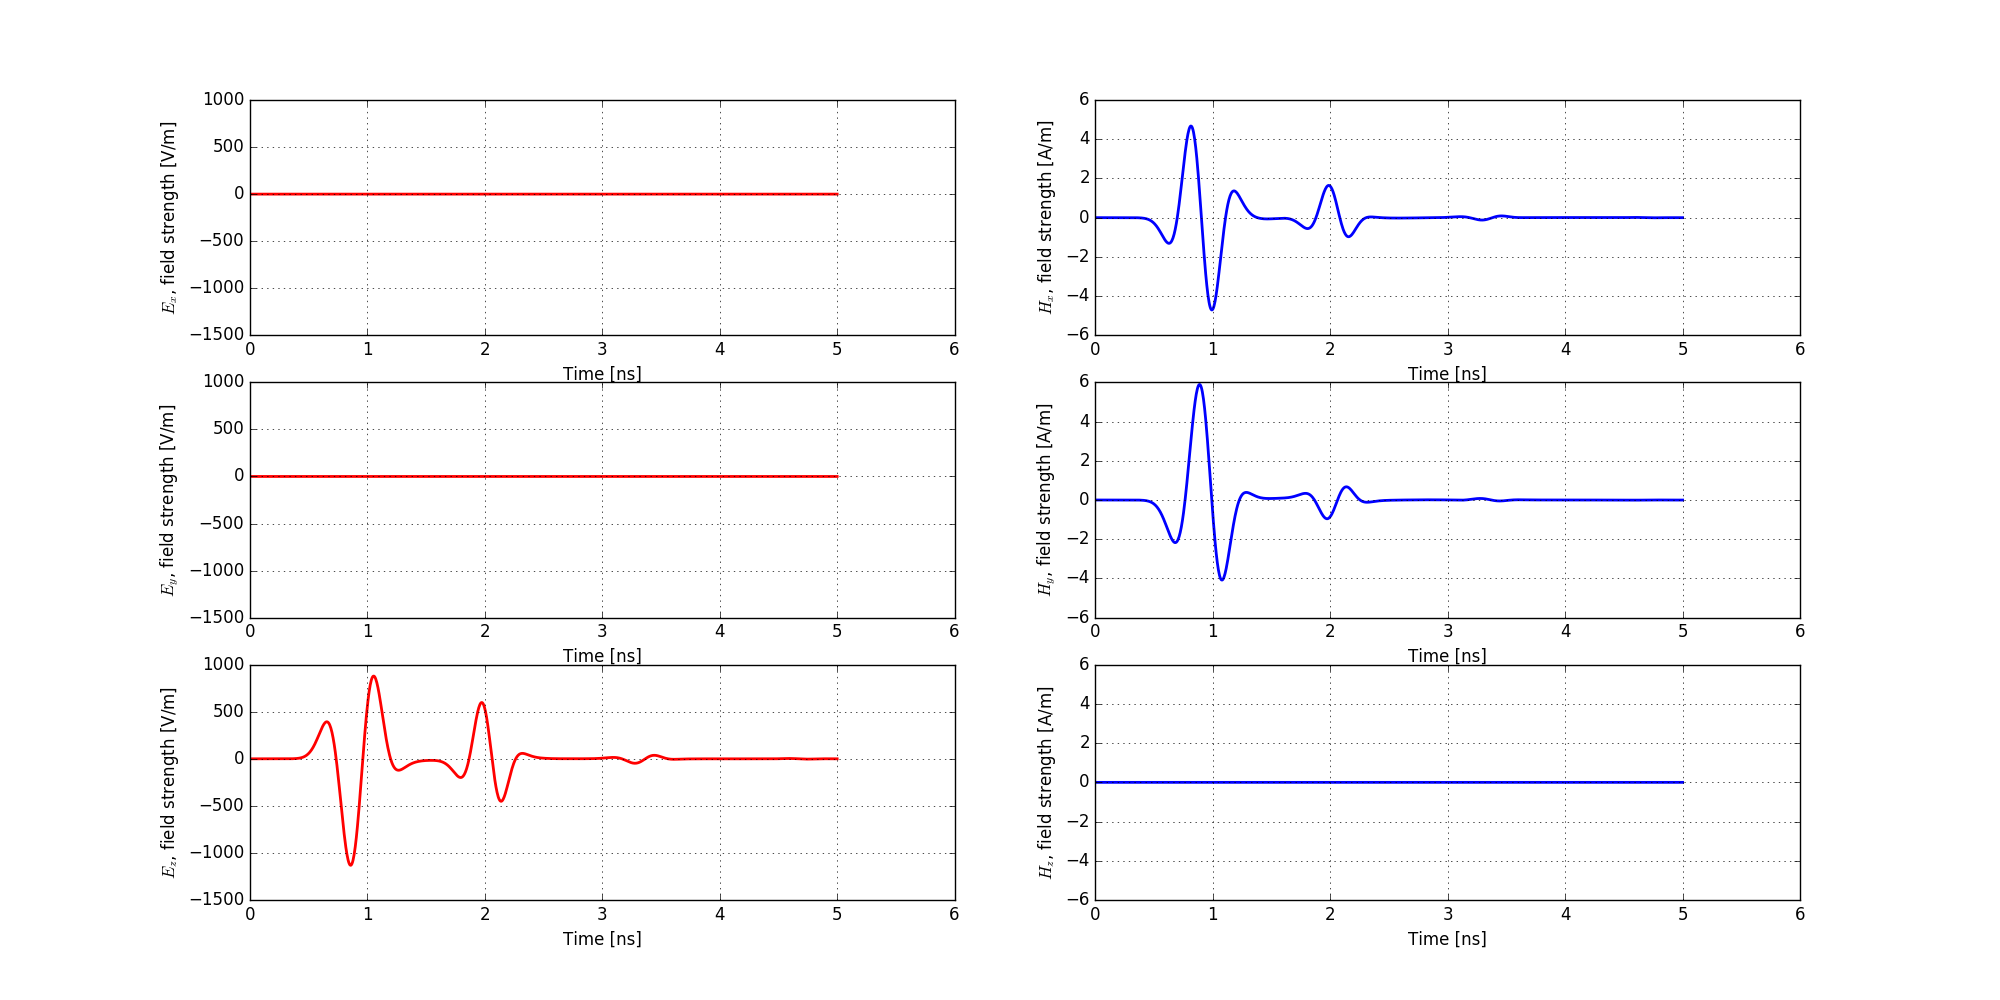
The three modelled electric and magnetic components Ex, Ey, Ez Hx, Hy, Hz can be obtained by calculating a theoretical pulse response of the medium:
Python’s #snapshot function can be added to the computational process. It allows to make a snapshot of a current modelling phase at a specific interval. The wave propagation in a specific medium can be visualized by combining the frames. The following figures (Figure 6,7,8) show Ez component only. The complete animations are available at www.georadar.org.pl.
Figure 6 Electromagnetic wave propagation, 1 ns snapshot, generated by gprMax and ParaView.
B-scan modelling and processing
The following part of the report focuses on modelling a 2D section of four pipes buried in a half-space. The modelled data, i.e. a synthetic B-scan image is transformed using standard procedures and compared with the original model.
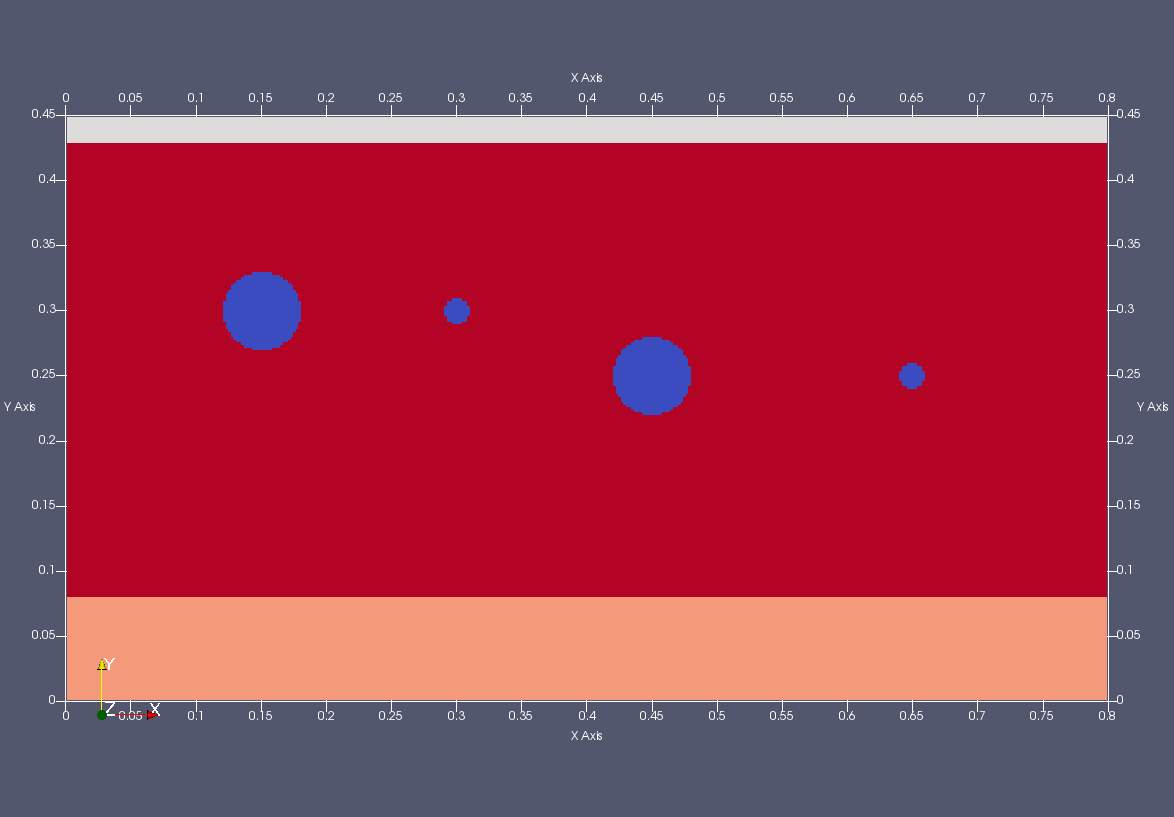
The analysed model includes a two-layer medium. The upper layer includes four (4) pipes with two different diameters at two different depths (Figure 9).
The resulting gprMax *.out files must be converted to SEGY format in Matlab software before use in the processing and interpretation software. SEGY format is compatible with the majority of available GPR data processing and interpretation software. GPRSoft PRO by Geoscanners AB, Boden (Sweden) was used in further interpretation of data.
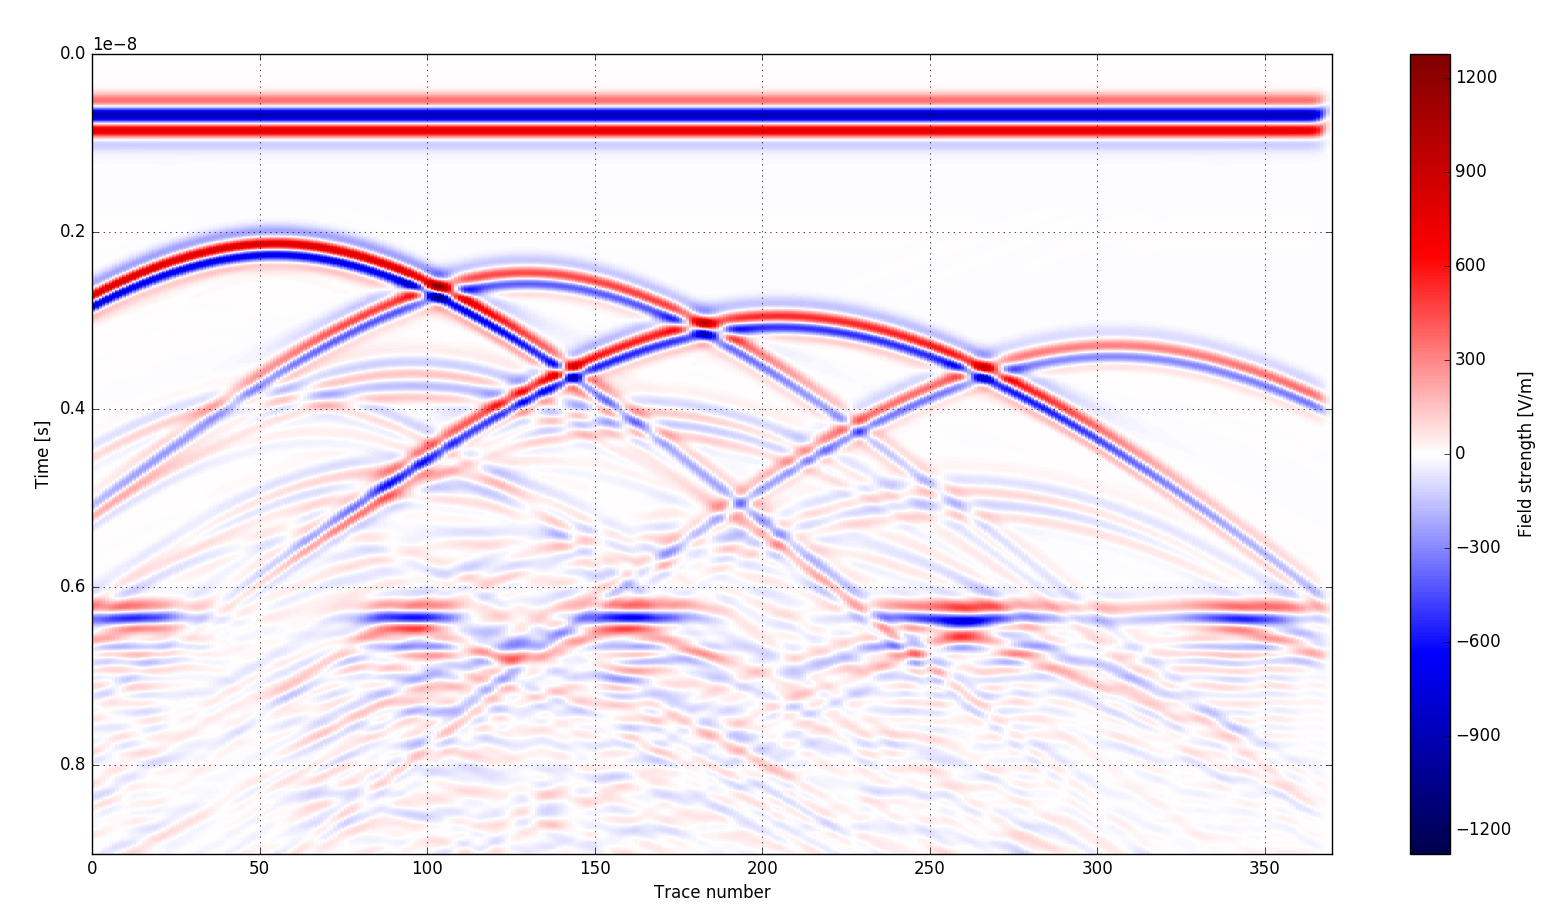
The section (Figure 11) includes four characteristic elements:
1. Direct wave in the upper section of the scan
2. Diffraction hyperbolas generated from the pipe surfaces
3. Horizontal layer, partially visible in the section
4. Poorly visible multiple reflections from the pipes
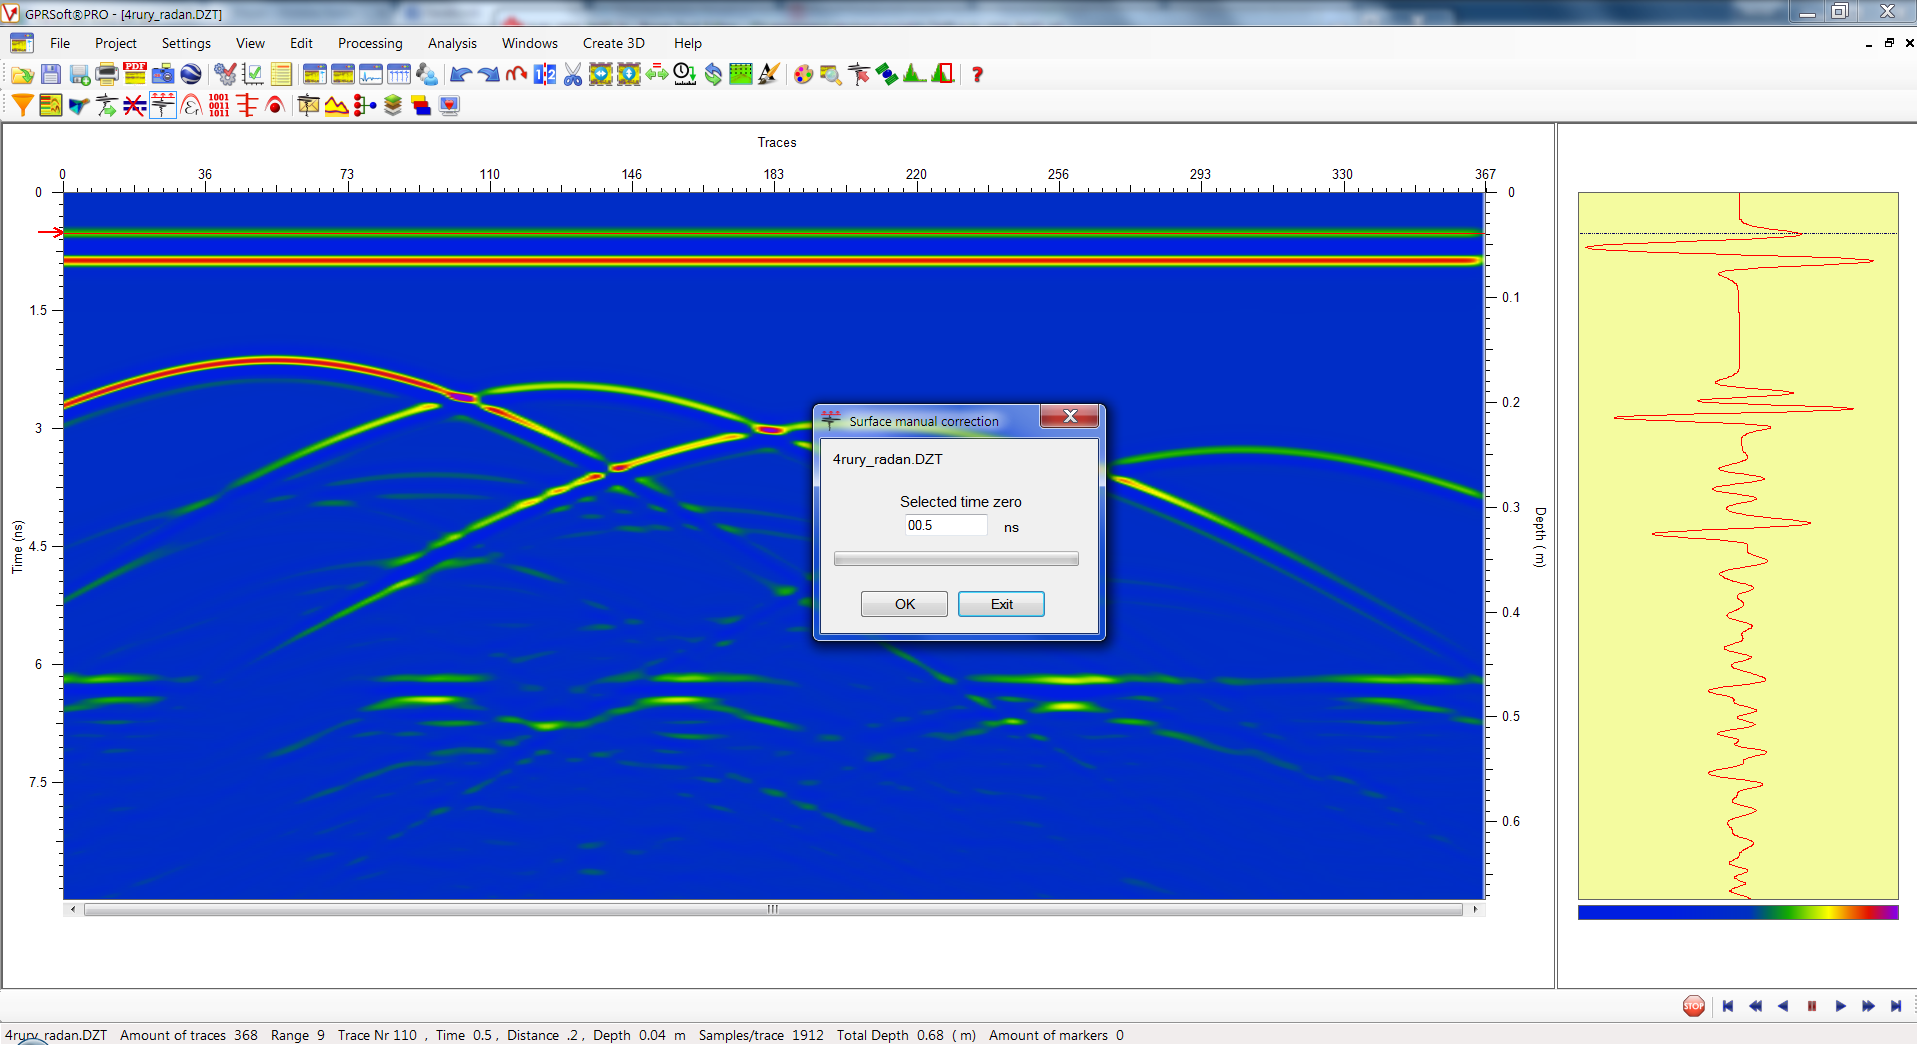
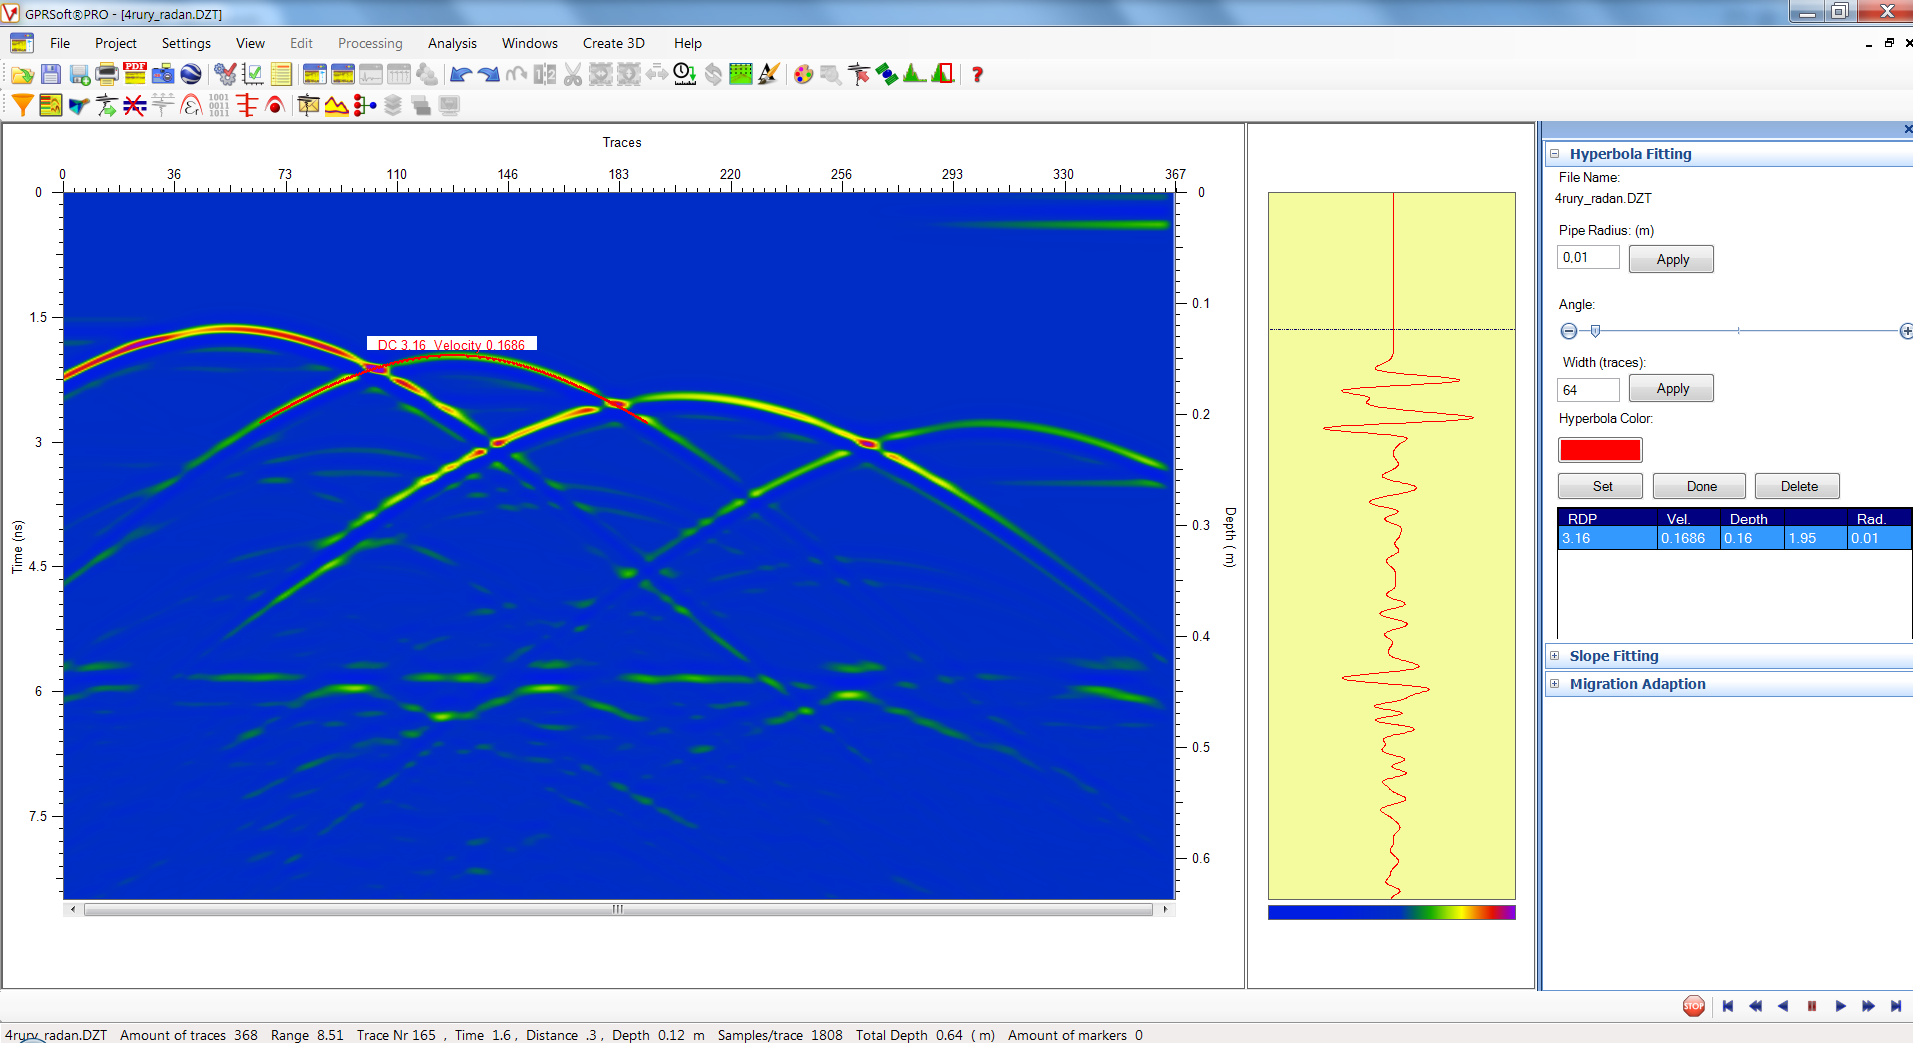
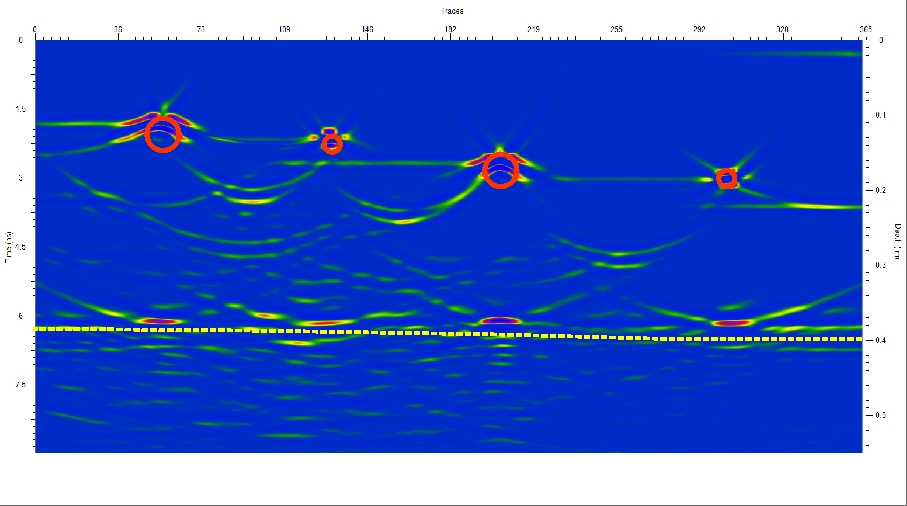
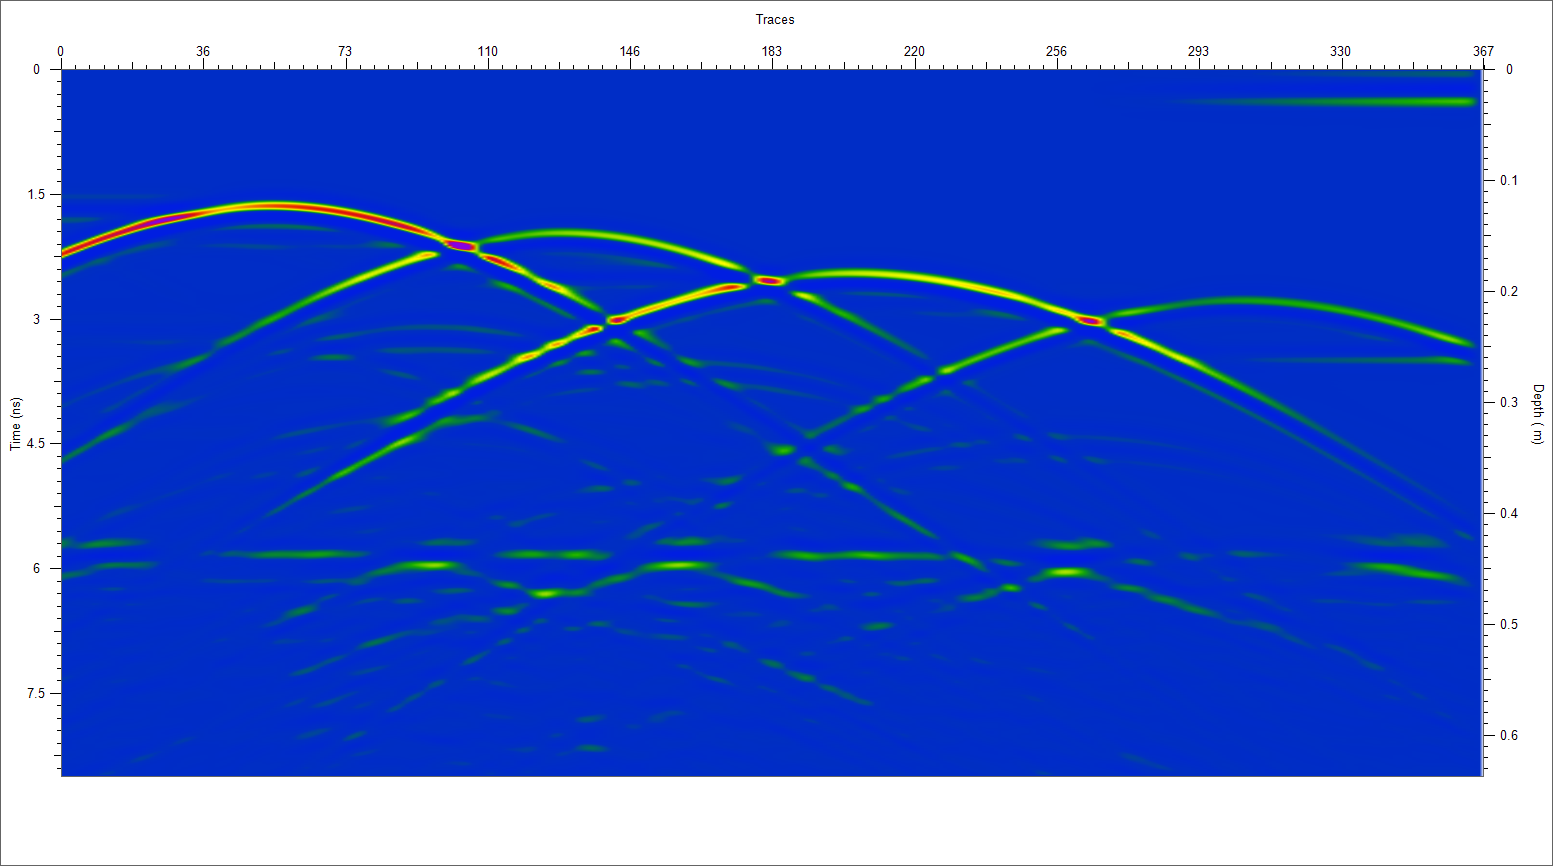
Figure 15 shows a clear correlation between the image after migration and the original model. Both pipe depth and diameter are relatively well represented. The boundary between the layers (yellow dotted line) is poorly visible due to the interference with the multiple wave. Modelling using gprMax can certainly be warranted based on the results. The experiment also validates the effectiveness of data processing procedures including the migration algorithm, which “offsets” the object reflections from their actual position. The migration allows to “roll” any circular or single-point objects which generate diffraction hyperbolas in the waveform to their original shape.
Conclusions
GprMax is a very useful tool for numerical modelling of Ground Penetrating Radar (GPR) data providing a synthetic waveform of very complex structures. GPR modelling in gprMax also allows to validate the interpretive principles for the field data. The synthetic data may also be a practical tool for testing the computational procedures used in the GPR wave field processing. At first glance, the tool is not easy to use for beginners, however with the aid of documentation available at www.gprmax.com, users can fully utilize a variety of available options and parameters.
As mentioned in the first section, the main benefit of the software is its free license. Although a 2D model was analysed, the software also allows 3D modelling. The dispersion and fractal functions, which can be assigned to any object or structure are an interesting tool to introduce anisotropy to the models. The computational times are relatively arduous. For a standard PC, the computational time for a simple model, e.g. a model with 4 pipes can take several hours. The software allows calculations of more complex models using multi-core computing clusters, however those require access to supercomputers.
References
[1] M. Dąbrowski, Georadar Blog, http://www.georadar.org.pl/, 2015
[2] Geoscanners AB, GPRSoft PRO manual, 2015
[3] A. Giannopoulos, C. Warren, gprMax manual, http://www.grpmax.com/, 2015
[4] H. M. Jol, Ground Penetrating Radar Theory and Applications, Elsevier, 2008, 508 p.
[5] J. Karczewski, Ł. Ortyl, M. Pasternak, Zarys metody georadarowej, 2011
[6] R. Persico, Introduction to Ground Penetrating Radar: Inverse Scattering and Data Processing, London, UK: Wiley-IEEE Press, 2014.